Tiktory
An analyst, a surveyor and a manager deciding where the next network point goes, on one map.
- Role
- Full-stack — backend, map interface, QA
- Stack
- FastAPI, SQLite, Leaflet, vanilla JavaScript
- Timeline
- November 2026
- Status
- Local demo · 31 API tests
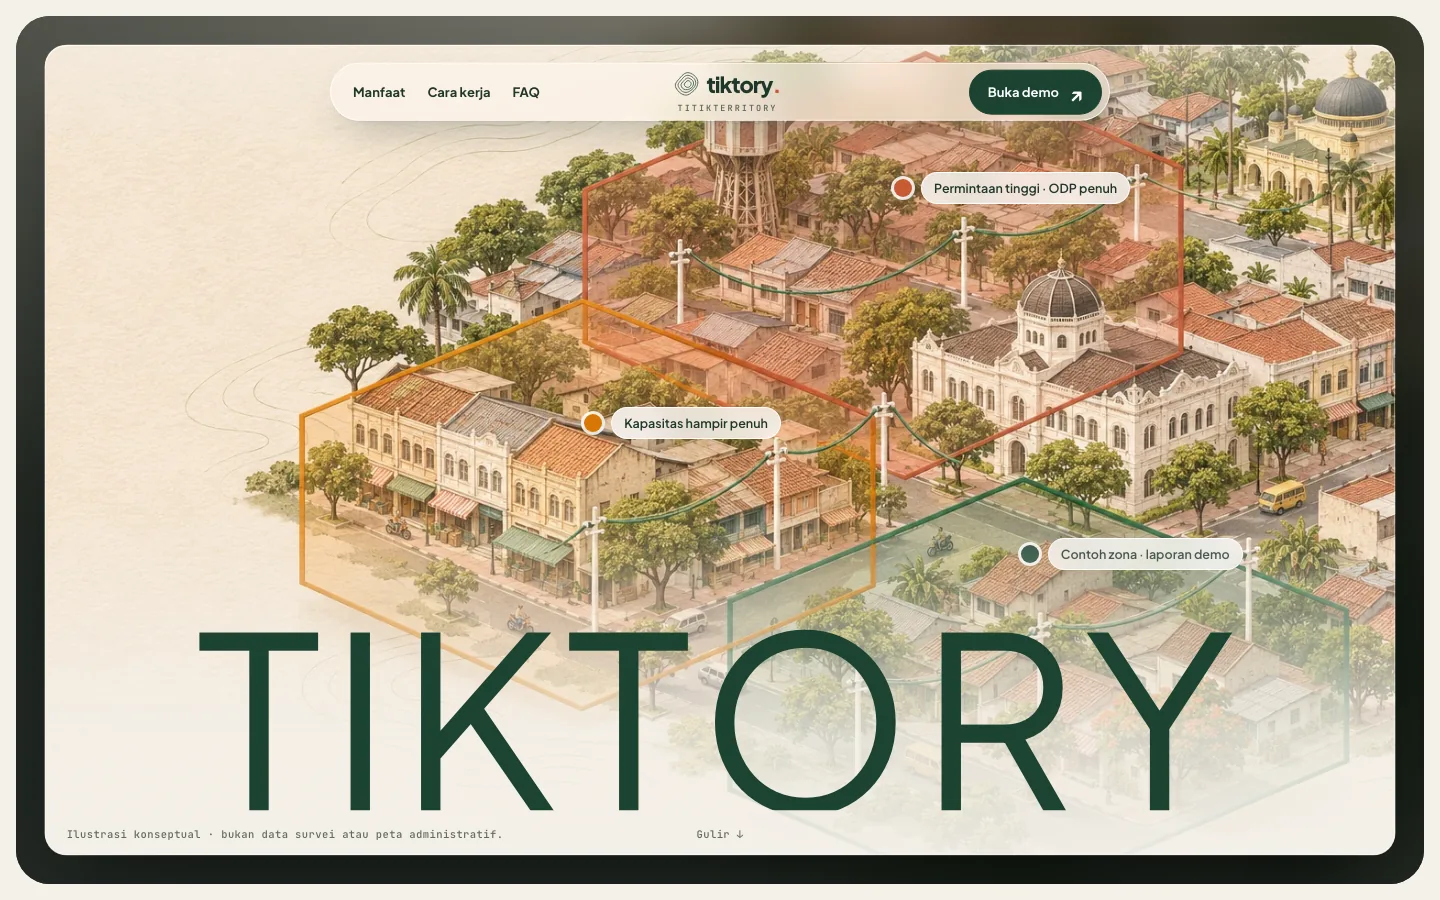
Opening a new network point is a chain of hand-offs.
An analyst spots demand, a surveyor checks the street, and a manager approves the spend, usually across spreadsheets and chat. Tiktory keeps the map, the cost estimate, the survey evidence and the decision in one trail.
Each hand-off’s question
| User | Main question |
|---|---|
| Analyst | Where is demand strong enough to justify a new point? |
| Surveyor | Is the location actually buildable? |
| Manager | Is the estimate sound — approve or defer? |
Map, survey, decision.
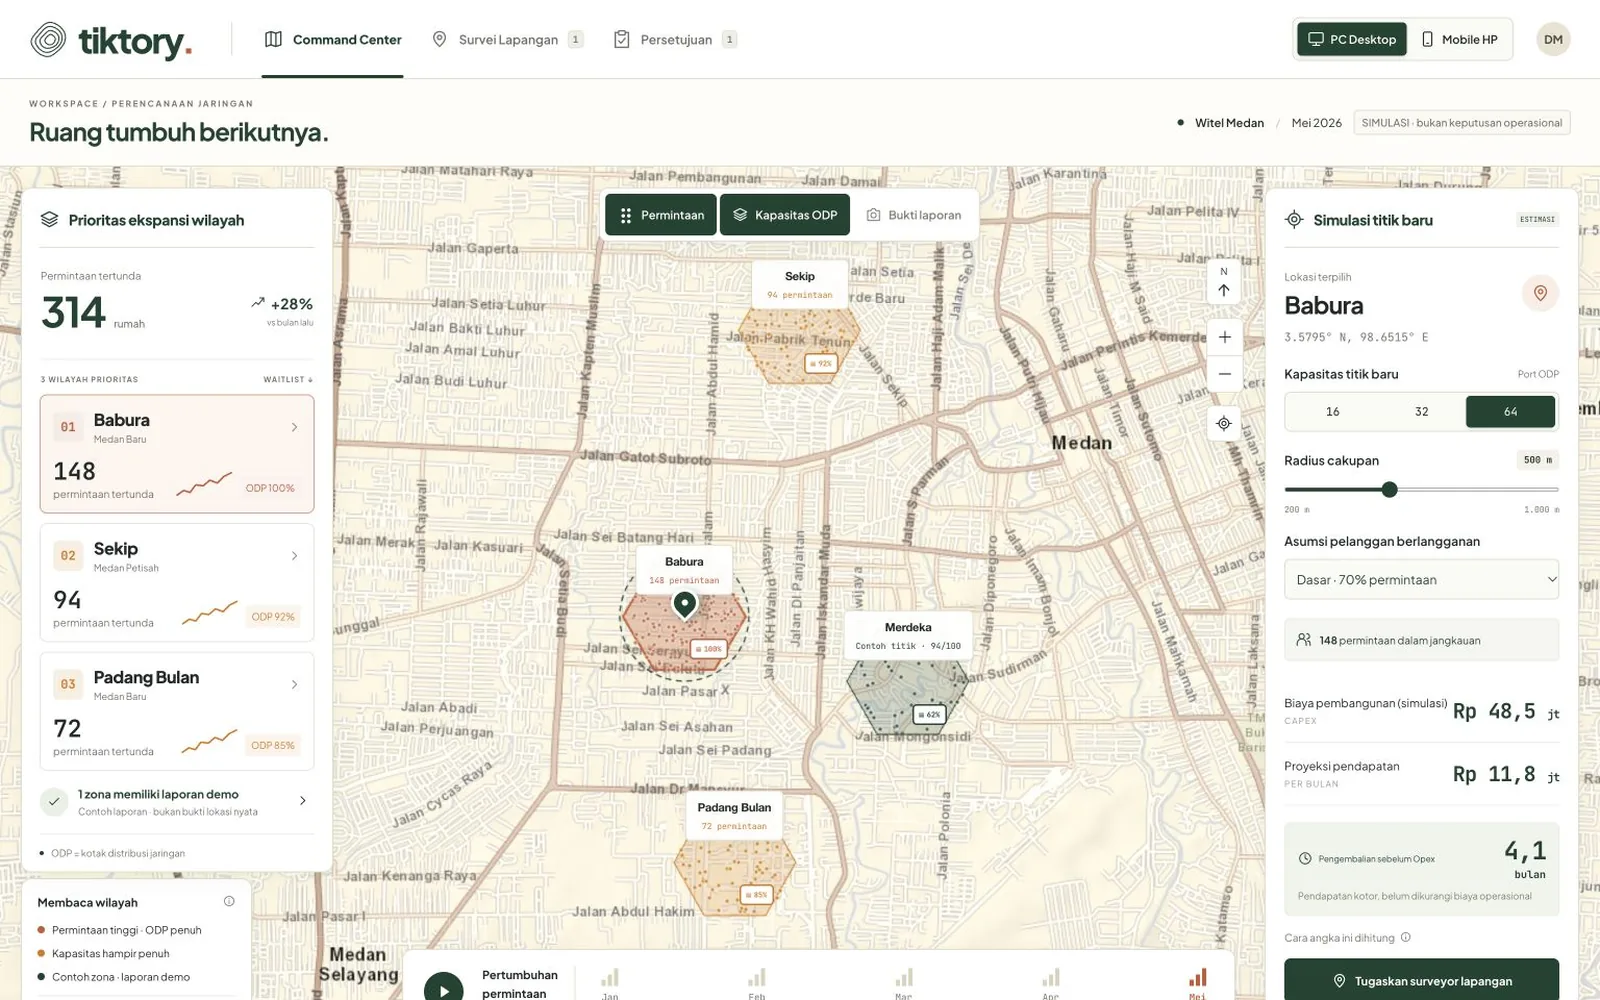
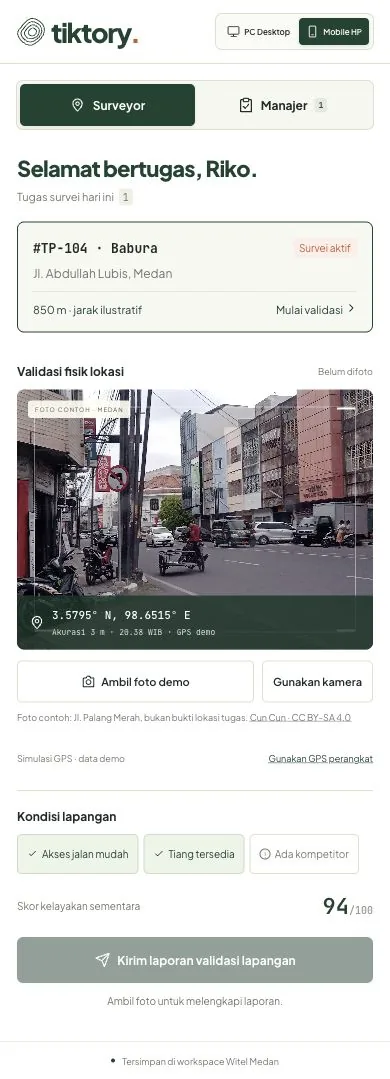
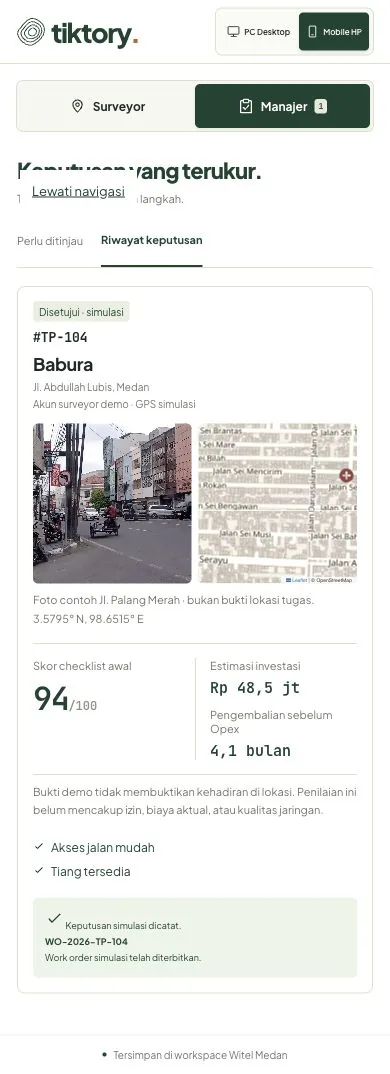
Demand hexagons and a cost simulator for the analyst, a mobile checklist with photo and GPS for the surveyor, and approve-or-defer with an audit history for the manager.
The landing page
A landing page explains the limits of the demo. Its hero frames the illustrated city in a window that opens to the edges as you scroll, with zone labels that use the same words as the map legend in the app.
64 ports, 500 metres, 4.1 months to pay back.
| Default point: 64 ports, 500 m, base scenario | Value |
|---|---|
| Capital expenditure | Rp48.5 million |
| Revenue | Rp11.8 million / month |
| Payback, before operating cost | 4.1 months |
| Simulated demand points on the map | 352 |
Illustrative model: Rp20 million + Rp320 thousand per port + Rp16,040 per metre of radius. Cable routes, operating cost, tax and churn are not included.
A demo that does not pretend.
Each keeps the demo from looking more certain than it is.
- 01
Server-side roles, even in a demo
Signed HttpOnly session cookies and backend role checks: the wrong role is rejected and cross-origin POSTs are refused.
- 02
Evidence labelled as simulated
Demo GPS and sample photos are marked as simulations, never as verified presence. Distant coordinates are rejected.
- 03
No duplicate proposals
A proposal within 100 m, or overlapping an existing coverage circle by more than 30%, is rejected; a retry returns the saved result.
- 04
Payback before operating cost
Conservative, base and optimistic conversion scenarios, with payback labelled as before operating cost.
31 API tests on a temporary database.
The full flow was checked in the browser on desktop and a 390 px phone.
- Not yet: a physical camera and GPS in the field, offline sync, load testing, or organisation sign-in.
- Hexagons approximate H3 resolution 8 and are not official boundaries. Basemap: Esri World Street Map.
What the 31 tests cover
Session and role checks, cross-site origins, photo privacy, the required checklist, GPS distance and accuracy, approval confirmation, audit, retries, duplicates, coverage overlap, and the ROI model.