OpsDW
One definition per KPI, and proof that the SQL, the BI model and the dashboard all report the same number.
- Role
- Solo — KPI definitions, data model, SQL, data-quality rules, testing; implemented with AI coding agents under my direction
- Stack
- PostgreSQL 18, Python + uv, pytest, Docker Compose, DAX (text only)
- Timeline
- November 2026
- Status
- Tested locally · not deployed · public source on GitHub
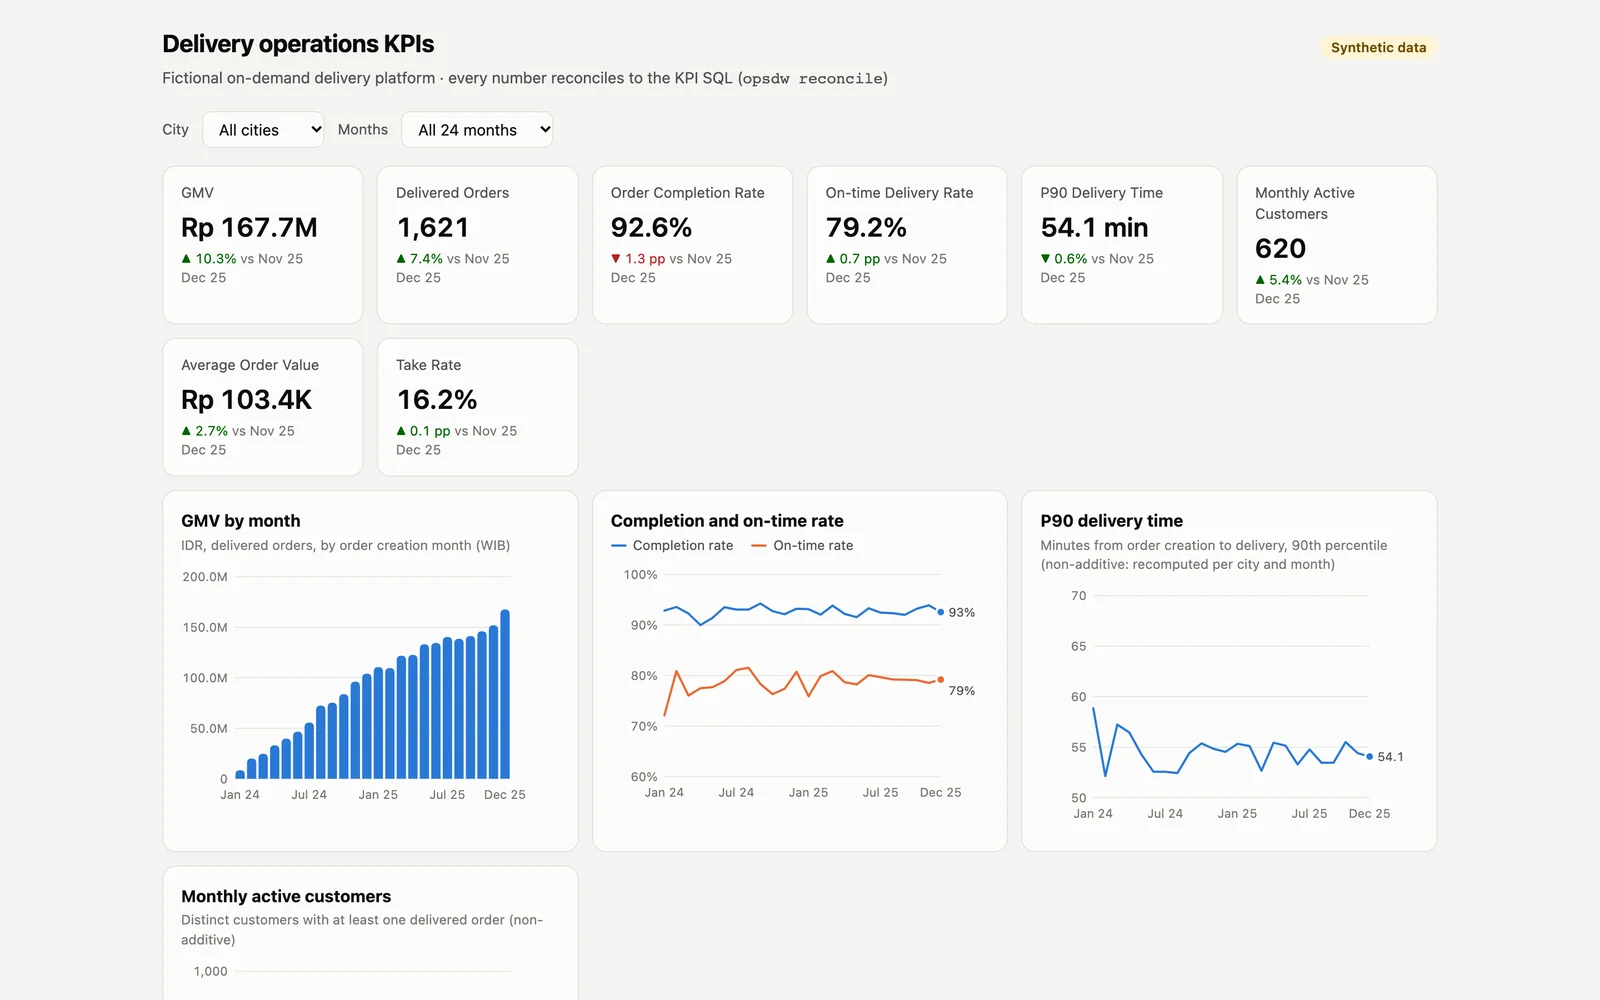
Two dashboards, two different GMVs.
A late delivery update misses the report. Old orders get a new commission tier. City P90s are averaged into a national one. The BI tool disagrees with the SQL.
OpsDW is a warehouse for a fictional delivery platform in six Indonesian cities. Its seeded generator logs every defect it injects, so each failure is tested against a known answer.
Every layer has a check.
Landing files → raw → staging → star schema → mart → BI views → dashboard.
- 01
Incremental, idempotent ETL
Each run merges only rows after a watermark, including late, duplicate and out-of-order ones. 53 incremental runs equal one full rebuild.
- 02
History kept where it changes money
Commission tiers are a type-2 slowly changing dimension: each order pays the tier valid when it was placed.
- 03
A data-quality gate that can fail
43 checks, from uniqueness to layer-to-layer reconciliation. Ten sabotage tests break the data; the gate must fail each time.
- 04
One KPI, three places, one number
Eleven KPIs, defined once, computed by the canonical SQL, the Power BI-ready model and the dashboard, then compared cell by cell.
How each layer is checked
- ETL: the merge and the new watermark commit in the same transaction, so a crash rolls back cleanly.
- History: one query measures how wrong historical commission would be if today’s tier were used instead.
- Gate failure: every sabotage test must make the gate exit with an error.
- Data-quality checks: uniqueness, referential integrity, accepted values, business rules, history integrity, freshness, and row and sum reconciliation between layers.
- KPI definitions: each records the question, numerator, denominator, grain, filters and caveats. Tests check that the comparison catches a wrong roll-up, such as averaging city percentiles.
Measured on 800,100 orders.
Median of seven runs; “before” has no indexes or partitions.
| Query | Physical design | Before → after |
|---|---|---|
| One month by city | Index on order date | 21.6 → 11.3 ms |
| A customer’s latest 20 orders | Composite index | 23.0 → 0.02 ms |
| Hourly deliveries over 7 days | Monthly partitions + index | 44.8 → 1.7 ms |
| One courier’s active days in a quarter | Partial index | 48.4 → 0.33 ms |
| 24-month dashboard trend | Pre-aggregated mart | 75.9 → 1.1 ms |
Invented data on one laptop: the effect of physical design, not production latency.
All checks, load times and setup
| Check | Result |
|---|---|
| KPI reconciliation: 11 KPIs × 24 months × 7 city views | 1,848 cells · 0 mismatches |
| Data-quality gate on the benchmark data | 42 pass · 1 expected warning · 0 fail |
| Fact orders vs the generator’s ground truth | 799,947 = 800,100 − 153 corrupt-only |
| Initial load of 4.4 million raw rows (ingest + transform) | 22.9 s + 93.3 s |
| Daily incremental run (~10,500 raw rows) | 2.0–3.5 s |
Benchmark volume: 800,100 orders and 3.58 million order events over two years, plus injected duplicates and corrupt rows. Each query ran seven times with EXPLAIN (ANALYZE, BUFFERS). All figures come from one run in a Docker VM (4 vCPU, warm cache) and say nothing about any real company.
The benchmark volume also exposed a bug the small dataset could not: one load step became quadratic once its key list outgrew memory, and was rewritten as a join.
Eighteen questions, each with a known answer.
Cohort retention, courier streaks, RFM, Pareto and more. Each runs in a test on a hand-built dataset and must return the hand-worked answer.
All query topics
Cohort retention, an order funnel, rolling 28-day active customers, delivery-time percentiles, courier streaks (gaps and islands), top merchants per city, RFM segments, repeat rate, year-over-year growth, Pareto concentration and a 7-day moving average.
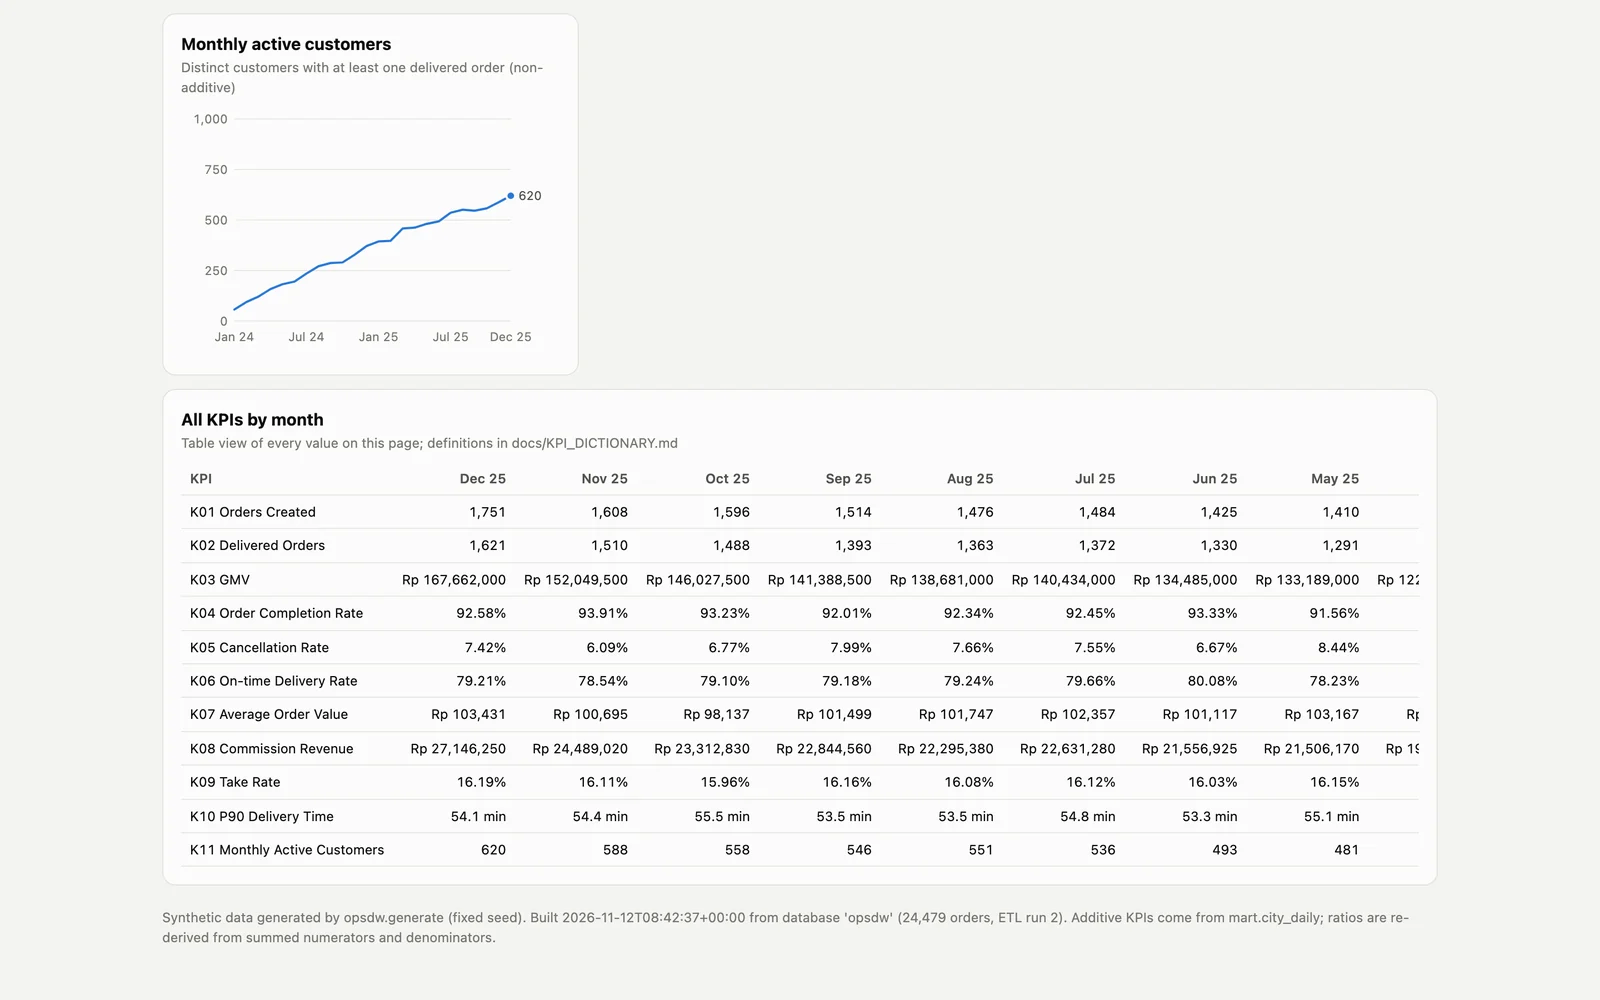
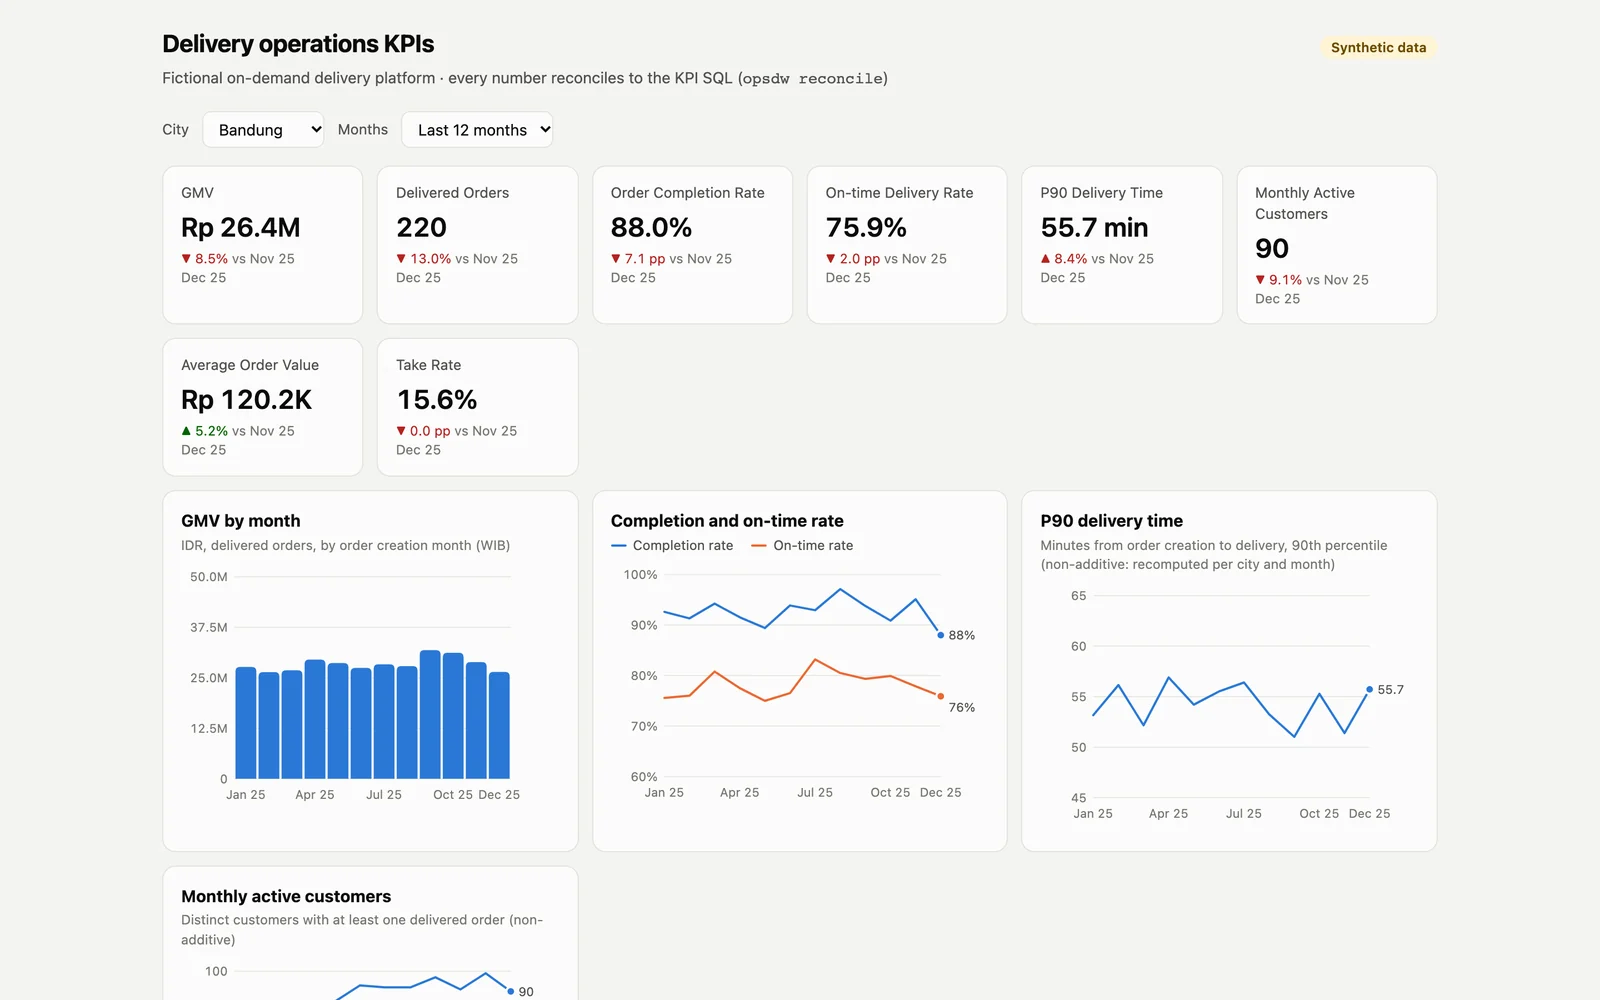
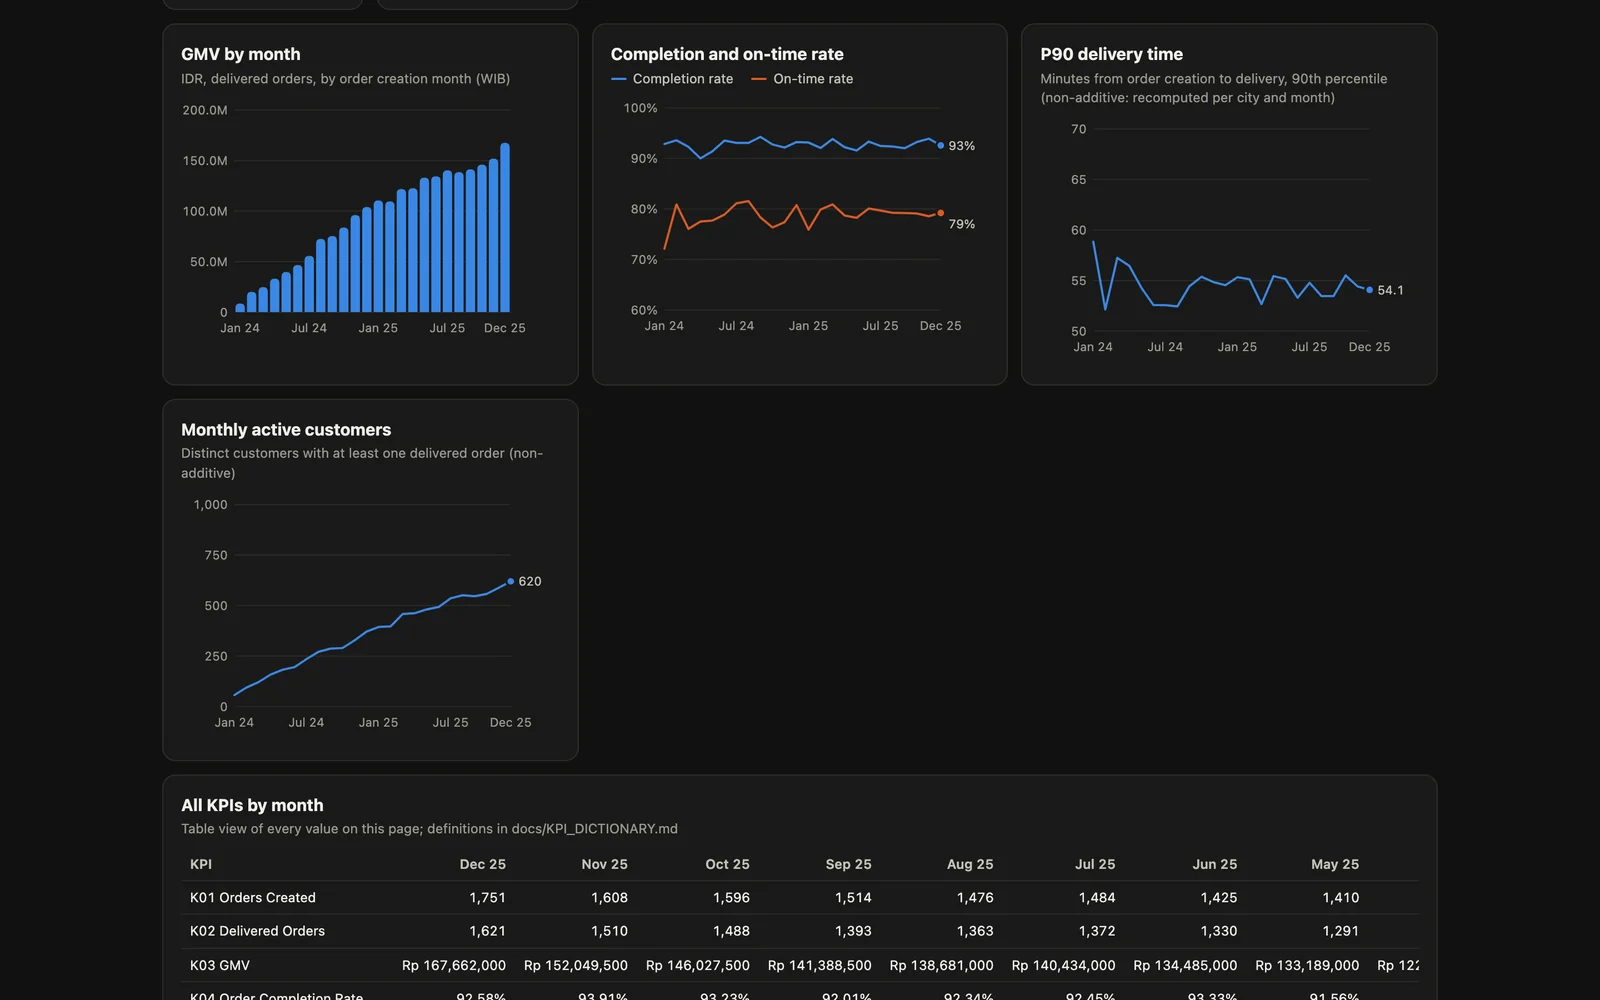
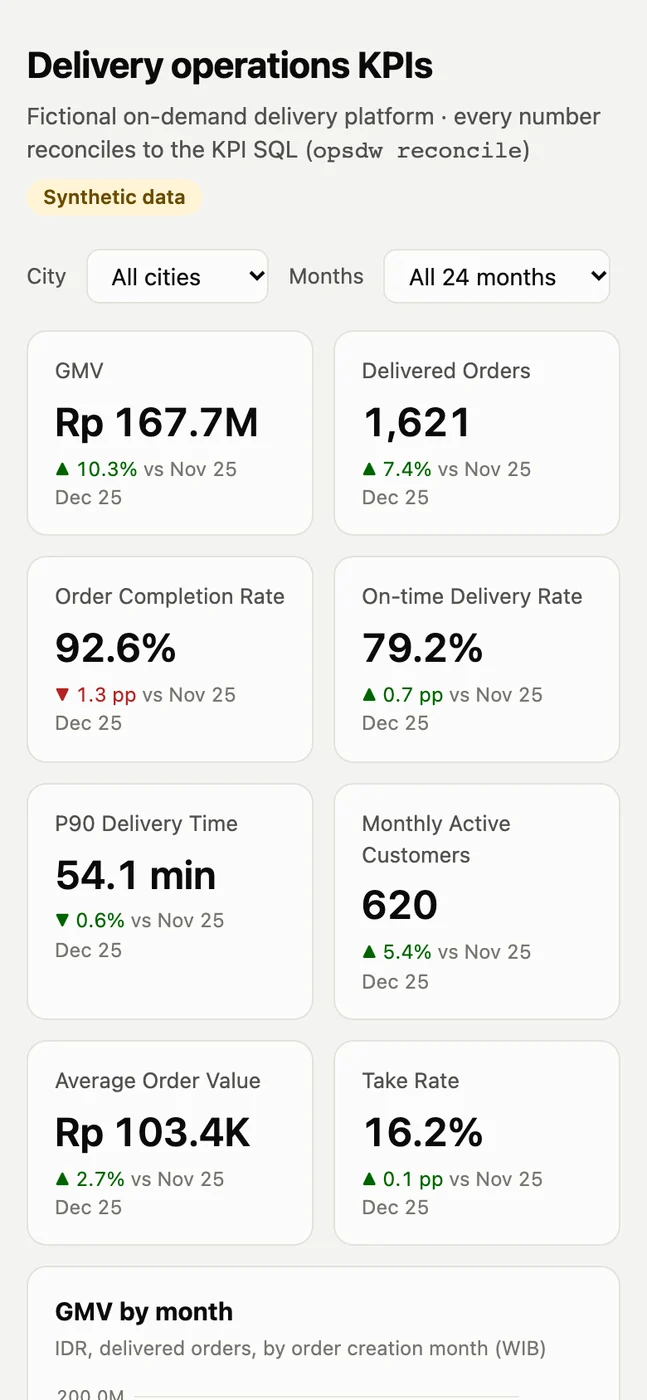
Tested on one laptop. No Power BI file.
One script rebuilds everything and reruns every check: all passing on 12 November 2026. A later independent code review found six issues, each fixed with a regression test.
- Not yet: a
.pbixfile. The DAX has never been run; only its SQL equivalent is tested. No scheduler, alerting or deployment. - The dashboard is static HTML regenerated by a command, not a live BI tool.
- Built with AI coding agents under my direction. Rerun every check from the public repo: github.com/dzahyk/opsdw.
Test and review detail
The script checks that re-running the transform changes nothing, the data-quality gate passes, the reconciliation shows zero mismatches and 54 tests pass (ETL behaviour, query results, sabotage cases, reconciliation). The review issues included invalid values such as “NaN” slipping through validation. The semantic model is delivered as views, documented relationships and DAX text; the DAX was not run because Power BI does not run on macOS. The results on this page come from the runs recorded in the repository; ./scripts/ci.sh reruns them.