Kinetix
Supplier scores you can take apart, and stock alerts that move with each supplier’s delays.
- Role
- Solo — domain research, data model, backend, UI, testing
- Stack
- Python standard library, vanilla JavaScript, Apache ECharts
- Timeline
- November 2026
- Status
- Prototype · 5 backend tests + 14 model checks

Supplier risk shows up only when the warehouse runs low.
In many factories, supplier performance and stock live in separate files.
The goal: one PO file in, and within minutes you know which supplier to review, which material runs out, and what a partial switch would change.
Who reads the file
From the product specSupplier performance and stock sit in different places, so risk becomes visible only after stock runs low.
A supplier that is often late looks like a problem only once stock is thin, and moving orders to another supplier is decided without numbers. Three people read the same file for different reasons:
| User | Main question |
|---|---|
| Procurement analyst | Which supplier should be reviewed first, and why? |
| PPIC planner | Which material runs out before the next delivery arrives? |
| Procurement manager | If part of an order moves to another supplier, what changes? |
Question, sketch, then build.
Before any chart I write down who reads it and what they must decide.
The three steps
For Kinetix, that was a procurement analyst with one purchase-order file.
The questionWhich supplier needs attention first, and why?
| Step | What happened |
|---|---|
| 01 · Question | One reader, one file, one decision to support: which supplier to review first. |
| 02 · Sketch | Three decisions on paper first. Clear: one score — delivery 40%, quality 35%, cost 25% — with every part on screen. Bold: a reorder line that moves with each supplier’s delays. Useful: a split test that only compares suppliers in the same category. |
| 03 · Build | The notes became Kinetix: a procurement workspace where every supplier score traces back to its purchase orders. |
A working prototype on synthetic data; no claimed business results.
Six modules, one purchase-order file.
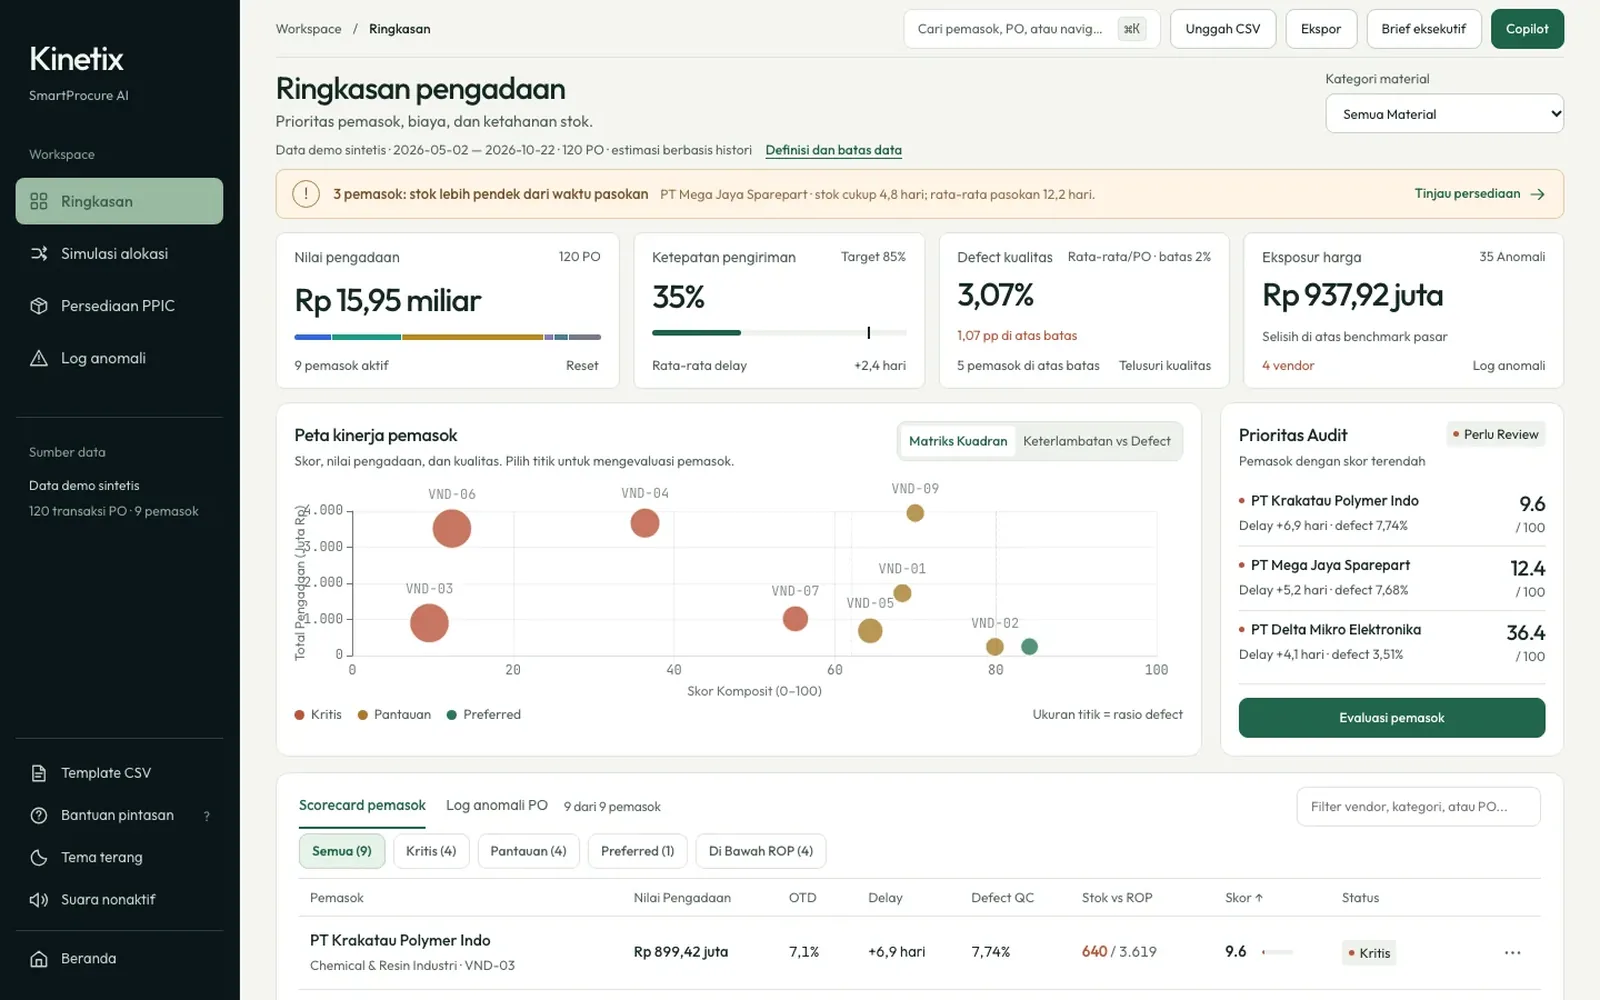
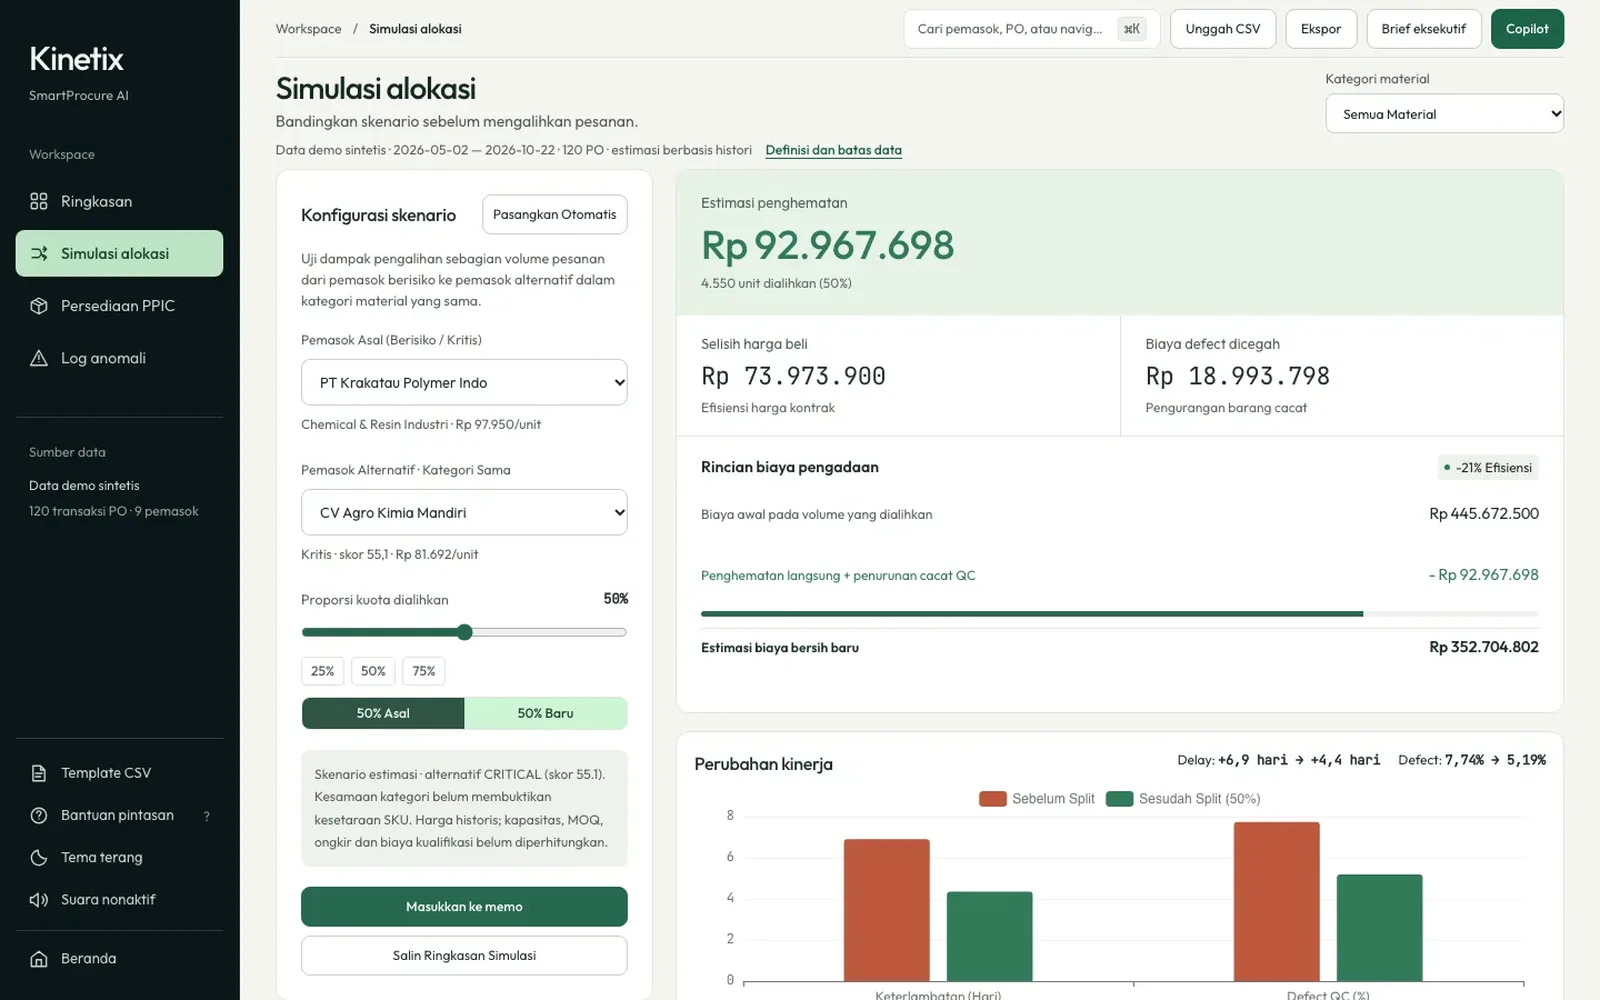
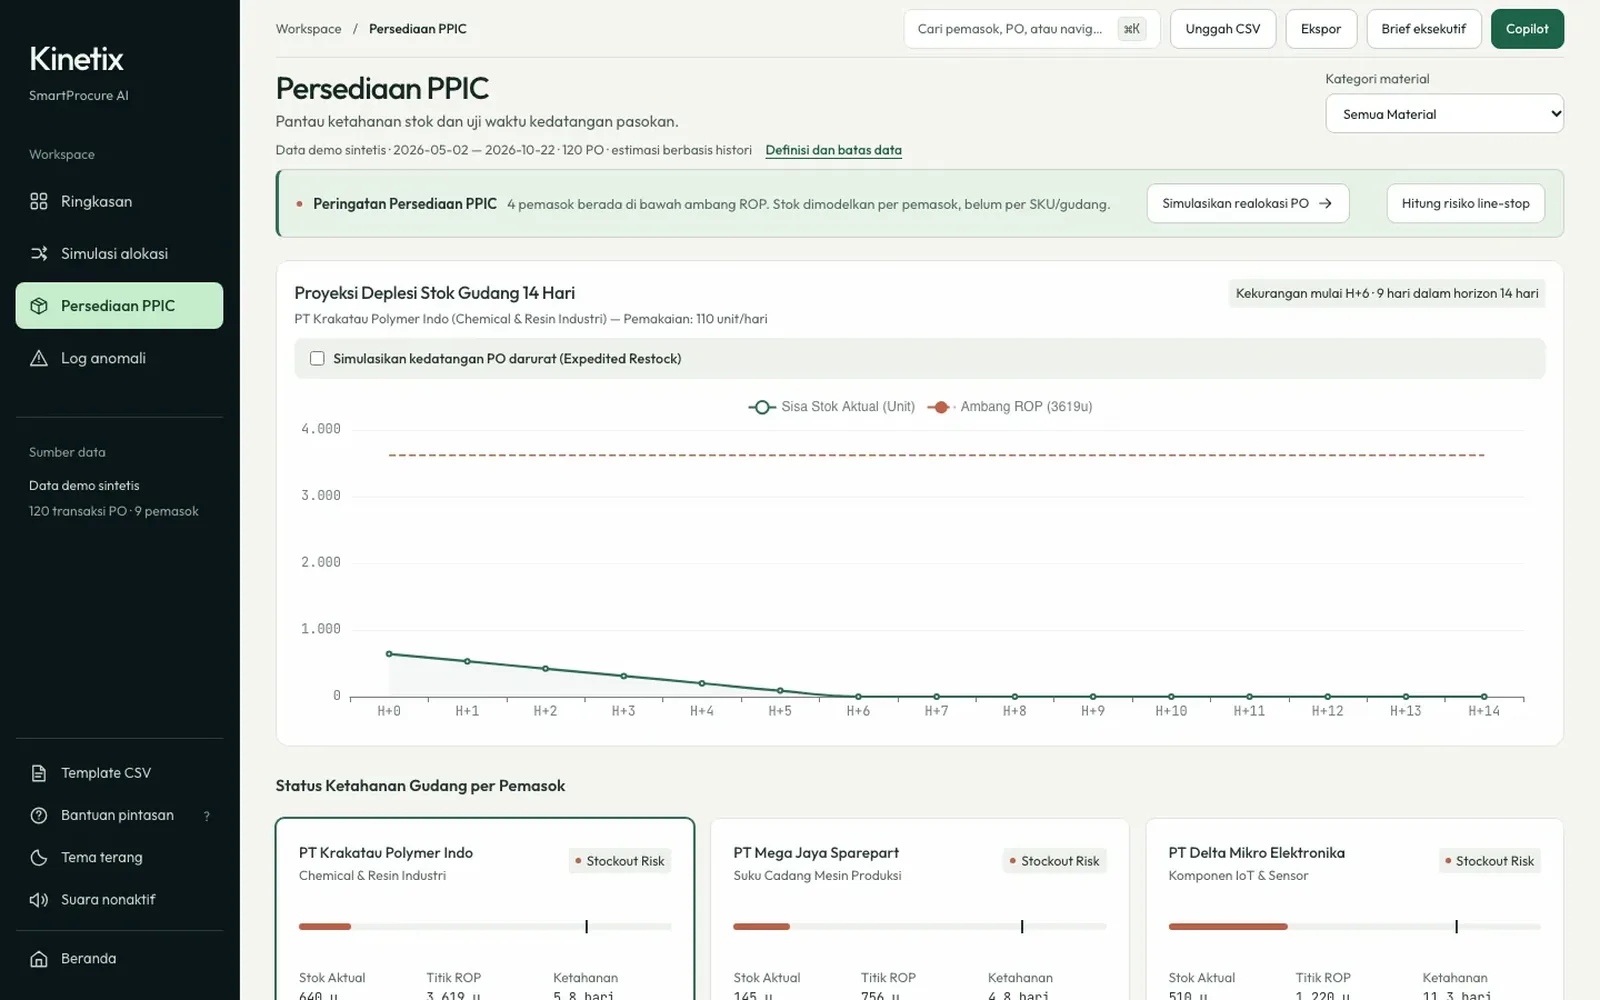
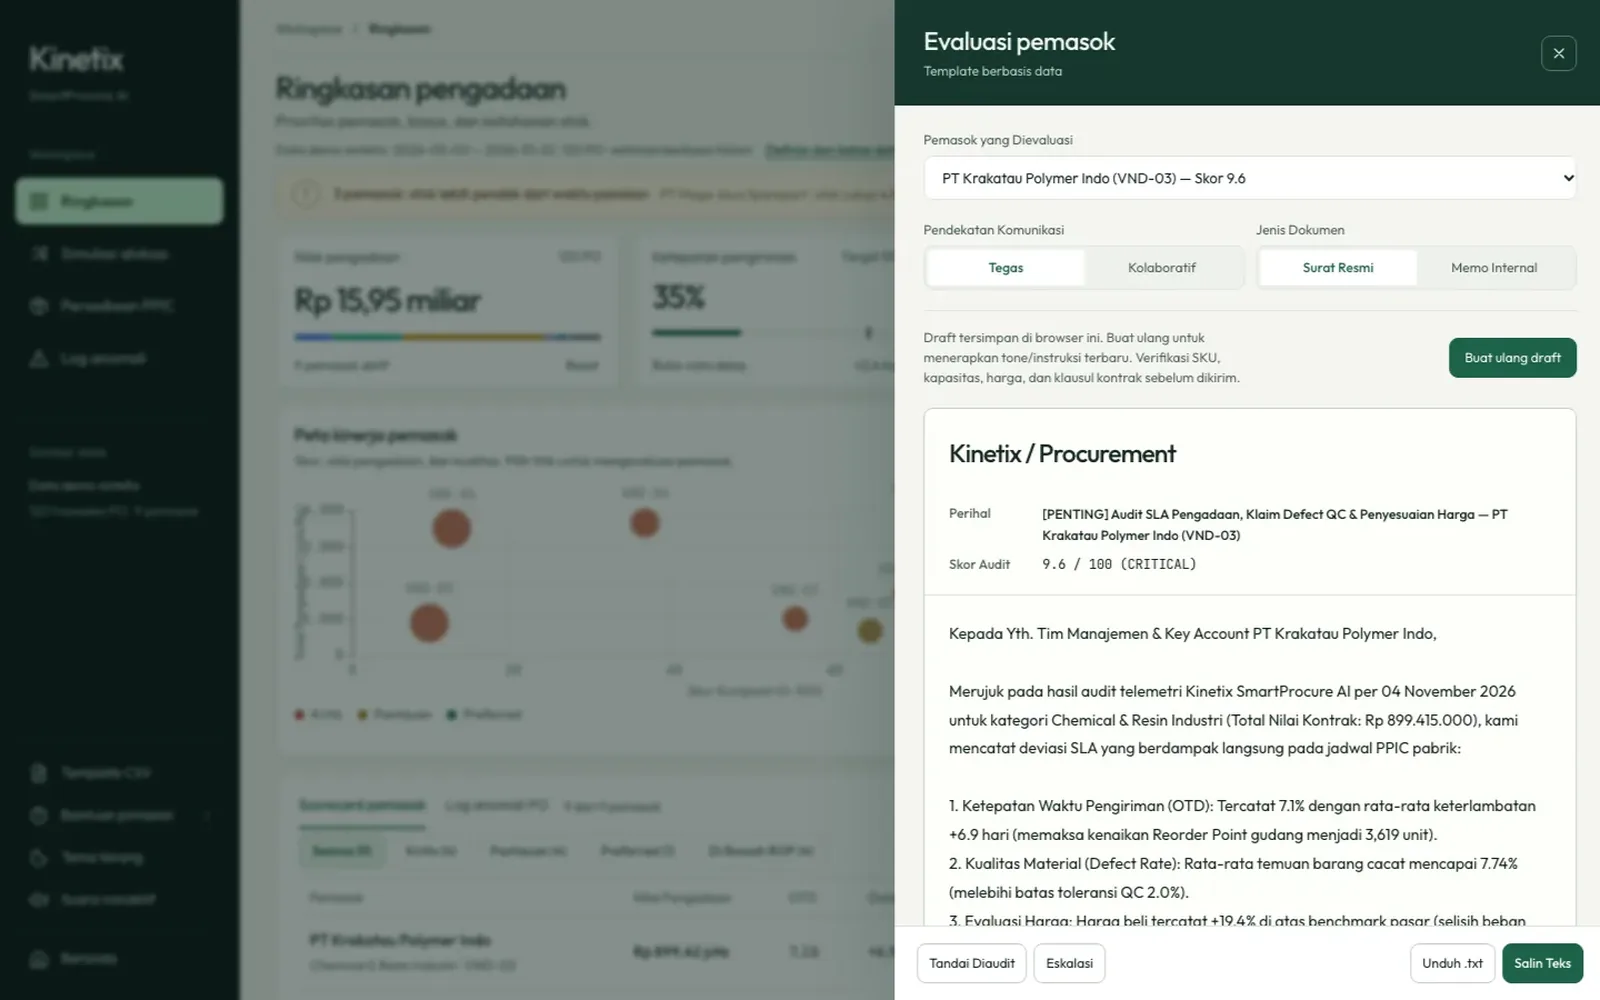
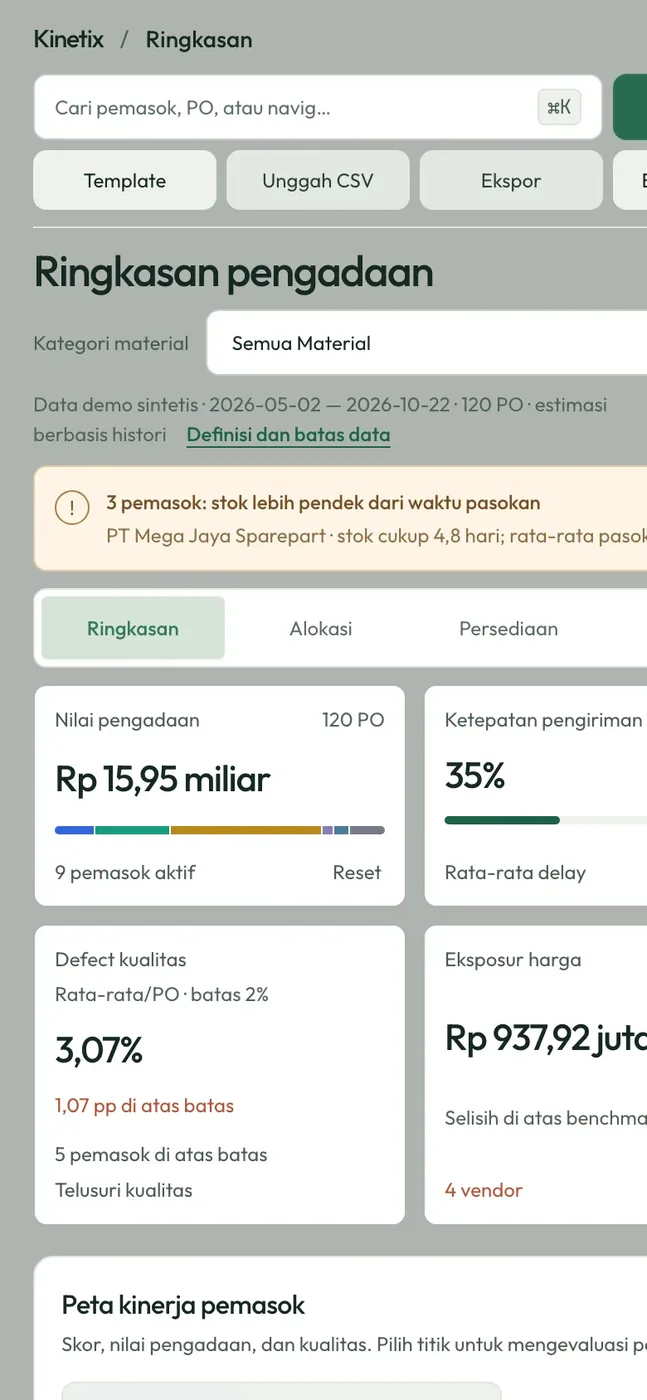
Overview, allocation simulator, PPIC inventory, anomaly log, letter copilot and decision tools. The CSV import reads Indonesian or English column names.
Less clever, more checkable.
Checkable numbers over a clever model.
- 01
A score you can take apart
Delivery 40%, quality 35%, cost 25%, every sub-score visible. Delivery weighs most: late material stops a line fastest.
- 02
Safety stock that follows the supplier
The reorder buffer grows with each supplier’s average delay and defect rate, not fixed days.
- 03
A simulator that refuses bad pairs
Splits only within one material category; an invalid pair hides the result instead of a misleading saving.
- 04
“AI” that works without AI
Letters come from a rule-based template; a language model is optional, on the user’s own key. No figure is invented.
What 120 synthetic purchase orders show.
| Finding | Value |
|---|---|
| Total spend analysed | Rp15.95 billion |
| Paid above market benchmark | Rp937.9 million |
| Overall on-time delivery | 35% |
| POs flagged as anomalies | 35 of 120 |
| Suppliers rated Critical | 4 of 9 |
| Suppliers below reorder point | 4 of 9 |
Synthetic data. It shows how the tool works, not business impact.
The guide’s calculators match the server.
The main flow was also hand-checked on desktop and a 390 px phone.
- Not yet: tested with procurement users, a live Gemini call, Safari or Firefox, or a full WCAG audit.
- Stock is per supplier, not per SKU; MOQ, freight and supplier capacity are not simulated.
What the tests cover
5 backend regression tests and 14 model checks cover invalid imports, invalid split pairs, letter tone, and the penalty and line-stop calculators. The formula calculators in the user guide match the server for all nine suppliers.